What is Elasticity of Demand

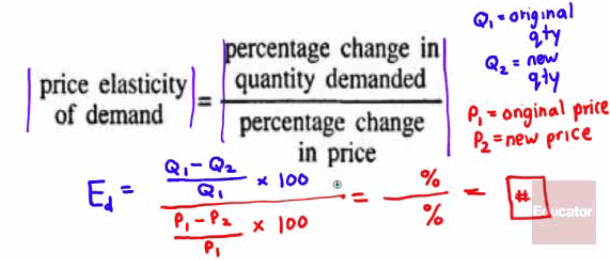
  • Price elasticity of demand (PED or Ed)

    • Measure used to show the responsiveness, or elasticity, of the quantity demanded of a good or service to a change in price.

    • Devised by Alfred Marshall, using the ceteris paribus (all other things being equal) assumption, price elasticity shows by how much quantity changes as a result of a change in price. (Disregard the negative)

    • Formula

    i)ud ru\!Gu0 001 aoud ut aiurqo aamiaond puetuap JO papuetuap Kmuenb
= aogd u\! ajueqo ainu

  • How to remember

    • Queen is greater than the Princess

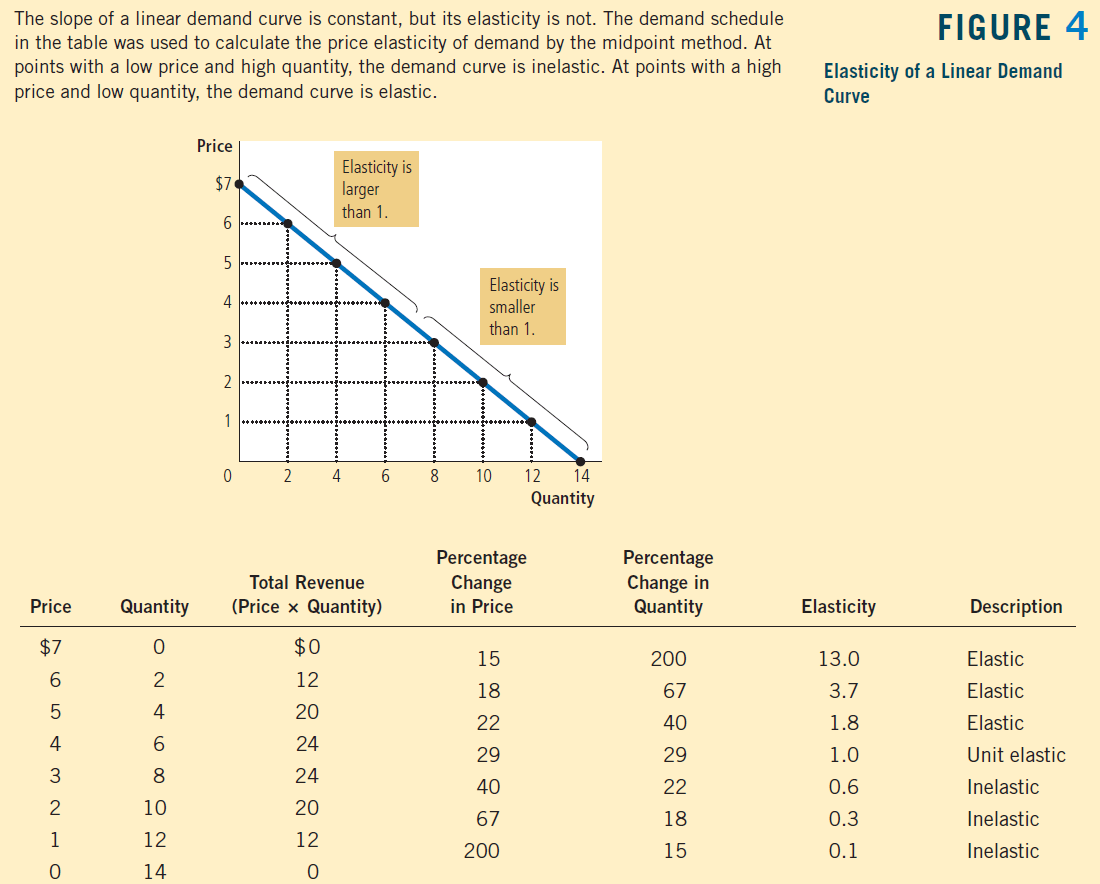
The Variety of Demand Curves
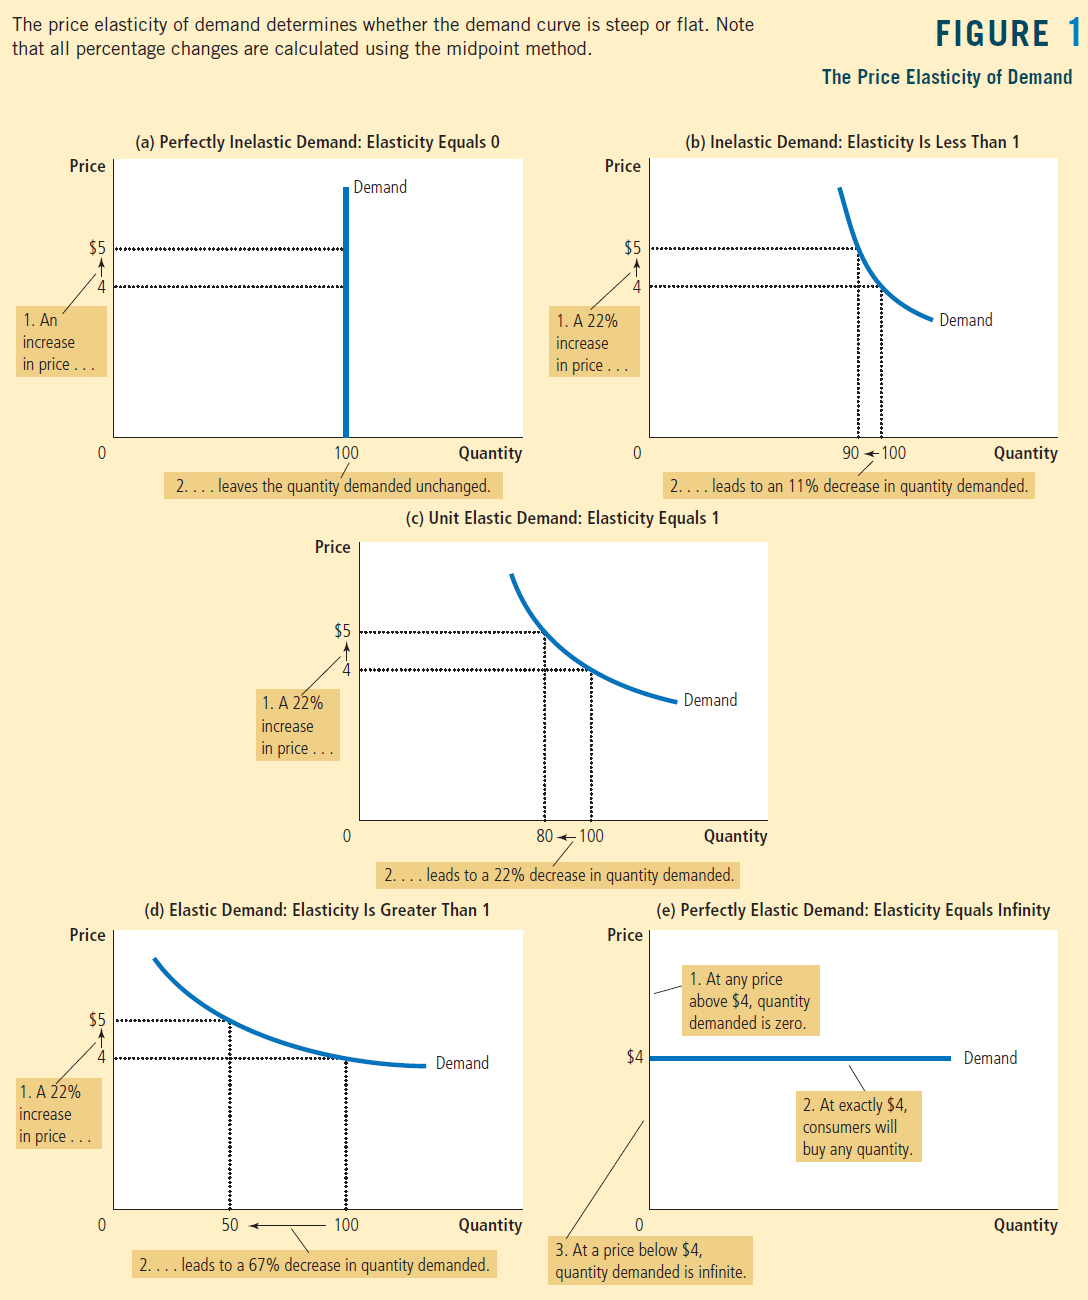
The price elasticity of demand determines whether the demand curve is
steep or flat. Note that all percentage changes are calculated using the
midpoint method 2.... 2.. 2.. 1 FIGURE The Price Elasticity of Demand
(a) Perfectly Inelastic Demand: Elasticity Equals 0 (b) Inelastic
Demand: Elasticity Is Less Than 1 Price $5 4 1. An Increase n price . 0
Price $5 4 Increase •n price 0 Demand IOO Price $5 4 Increase In pnce .
Quantity 90 IOO Demand Quantity leaves the quantity demanded unchanged.
.. leads to an 11% decrease in quantity demanded. (c) Unit Elastic
Demand: Elasticity Equals 1 Price $5 4 Increase In price 0 IOO Demand
Quantity .. leads to a 22% decrease in quantity demanded. 2.. (d)
Elastic Demand: Elasticity Is Greater Than 1 50 IOO Demand Quantity
Price $4 0 (e) Perfectly Elastic Demand: Elasticity Equals Infinity . At
any price above $4, quantity manded is zero. Demand . At exactly $4,
consumers will buy any quantity. Quantity .. leads to a 67% decrease in
quantity demanded. 3. At a price below $4, quantity demanded is
infinite.

Elastic Demand

  • When e > 1, demand is elastic, or the percent change in quantity is greater than the percent change in price.

  • It means that the product is relatively price-sensitive

  • ie. fast-food restaurants, fruits, haircuts

  • Demand curve is relatively flat.

Inelastic Demand

  • When e < 1, demand is inelastic, or the percent change in quantity is less than the percent change in price.

  • It means that the product is not very sensitive to a change in price

  • ie. gasoline, insulin

  • Demand curve is relatively steep.

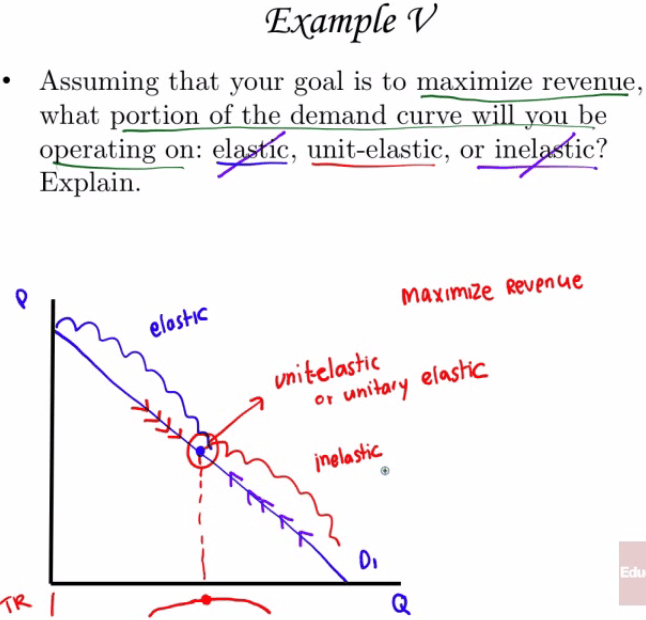
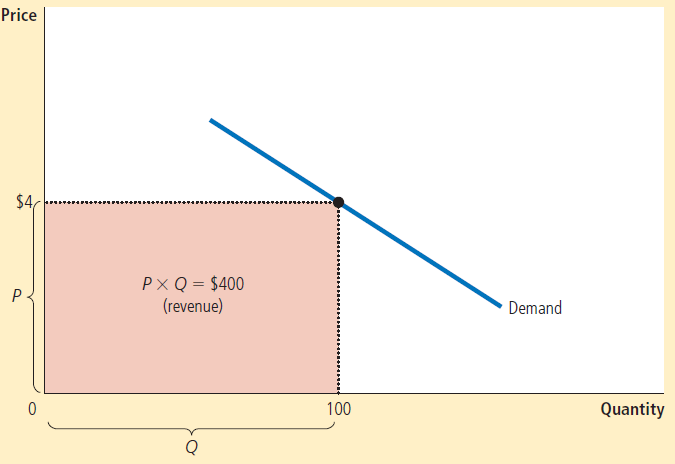
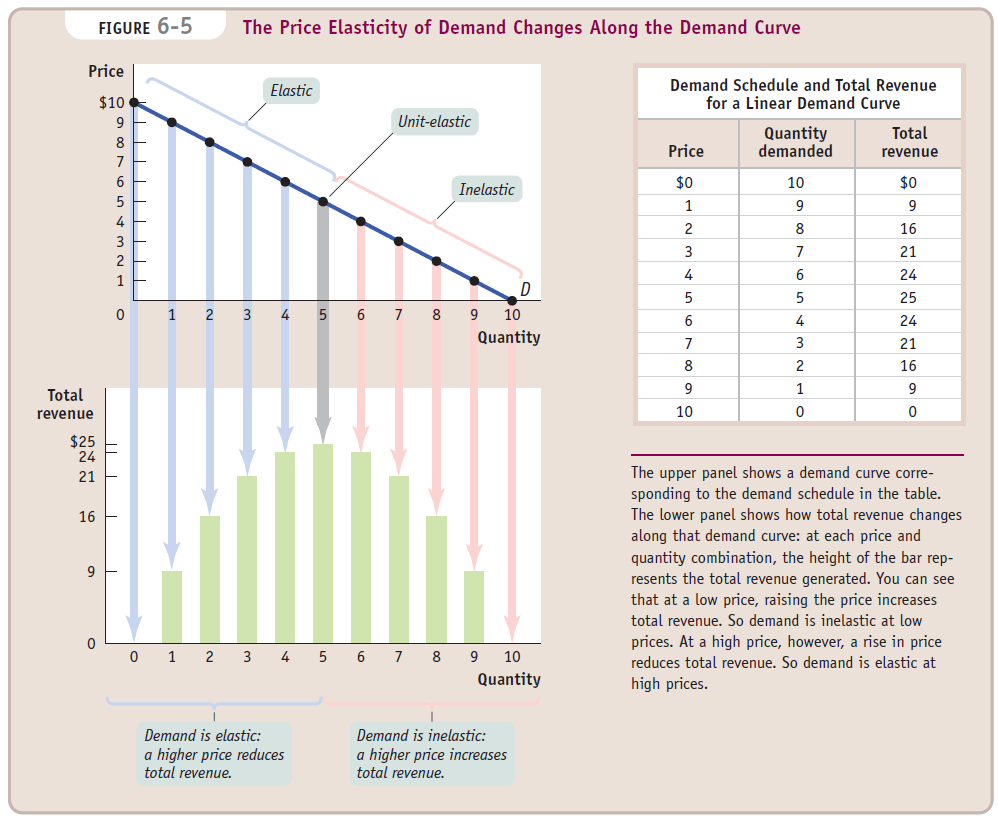
Price Elasticity of Demand and Total Revenue

  • The total amount paid by buyers, and received as revenue by sellers, equals the area of the box under the demand curve.

    Price $4 PX Q = $400 (revenue) IOO Demand Quantity

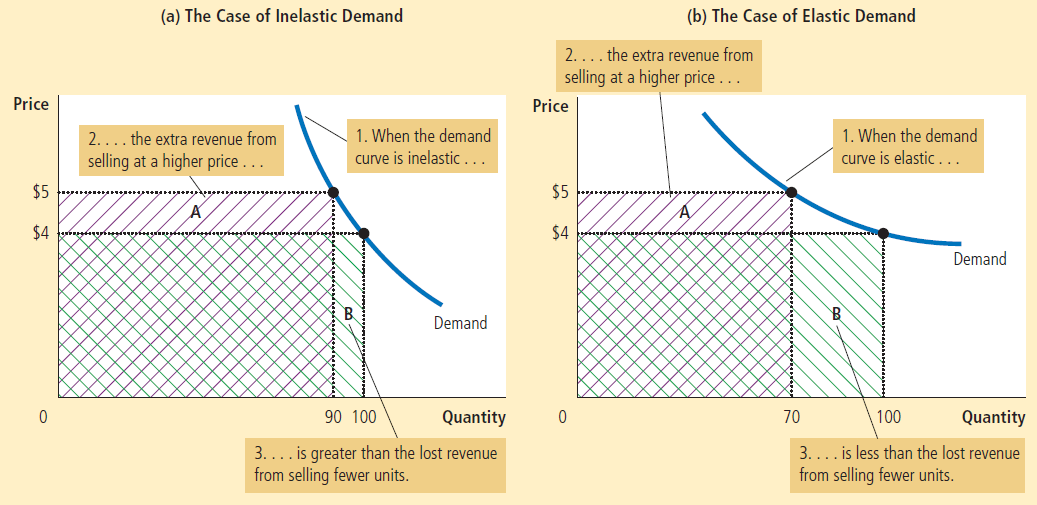
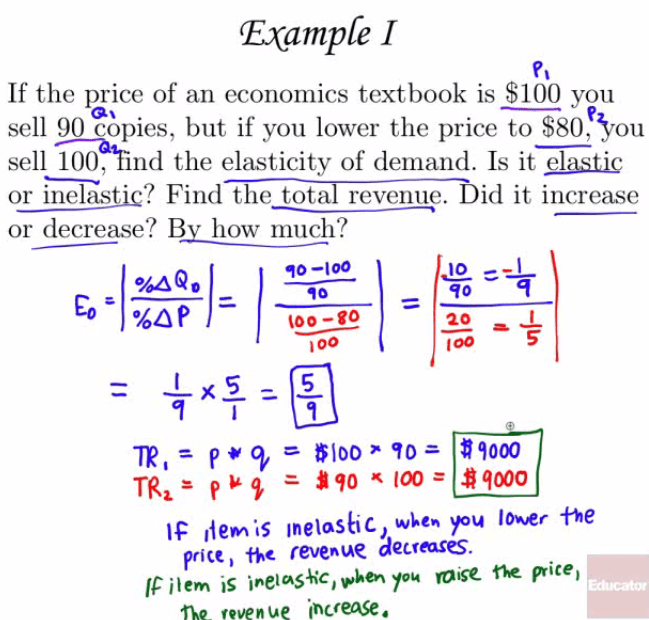
  • When demand is inelastic (e < 1), price and total revenue move in the same direction:

    • If the price increases, total revenue also increases.
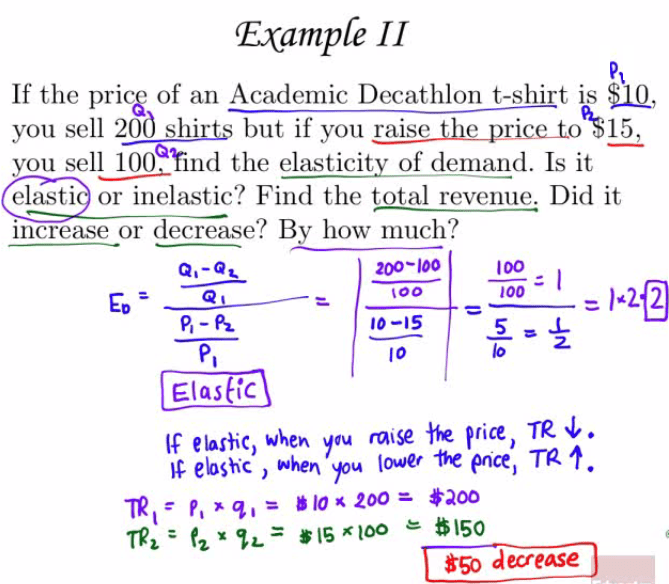
  • When demand is elastic (e > 1), price and total revenue move in opposite directions:

    • If the price increase, total revenue decreases.
  • If demand is unit elastic (e = 1), total revenue remains constant when the price changes.
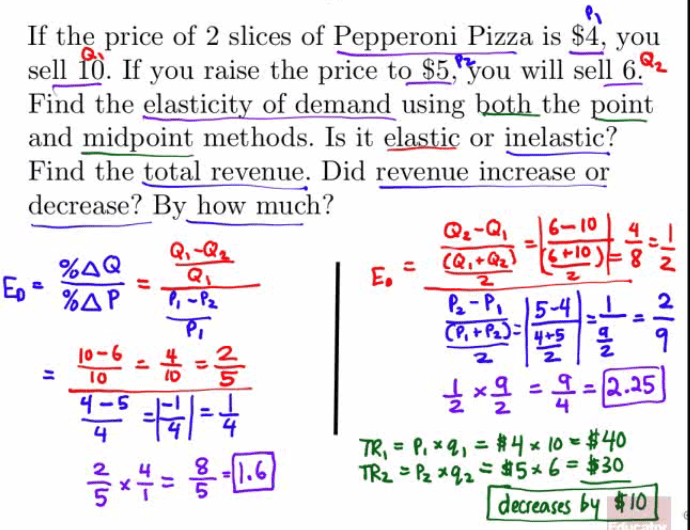
    Price 2 .. the extra revenue from selling at a higher price .. (a)
The Case of Inelastic Demand (b) The Case of Elastic Demand 3... 1.
When the demand curve is inelastic the extra revenue from 2....
selling at a higher price . Price $5 $4 0 1. When the demand urve is
elastic $5 $4 90 IOO Demand Quantity 70 IOO Demand Quantity . is
greater than the lost revenue 3... from selling fewer units. . is less
than the lost revenue from selling fewer units.

  • Examples

    Example I If the price of an economics textbook is $100 you sell 90
apies, but if you lower the price to $80, \#'011 sell filhänd the
elasticity of demand. Is it elastic Find 7178ÄäÄlTÄGiG8Ä)icI it
increase or decrease? By how much? o,zQ0 40 —100 -go 100 5 10 = 80 =
89000 — 100 = $qooo Inelastic, wben you price , fie revenue decreses.
ilem iS 'OiSZ fie price) revenue increase,

    Example 11 If the pric.& of an Academic Decathlon t-shirt is ELL,
you sell shirts but if you you sell the elasticity of demand. Is it
elasti or inelastic? Find the total revenue. Did it iiiöi•éåse or
decrease? By how much? Q,-Qc Elastic 200\* 100 too 10-15 10 100 100 10
If elas}iC) when you raise He price, TP- ebshc when lower encej TR b
200 = $200 decrease

Midpioint Method to Find Elasticity

  • Definition

    One way to avoid this problem is to use the midpoint method for
calculating elas- ticities. The standard procedure for computing a
percentage change is to divide the change by the initial level. By
contrast, the midpoint method computes a per- centage change by
dividing the change by the midpoint (or average) of the initial and
final levels. For instance, $5 is the midpoint between $4 and $6.
Therefore, ac- cording to the midpoint method, a change from $4 to $6
is considered a 40 percent rise because (6 4) / 5 X 100 40. Similarly,
a change from $6 to $4 is considered a 40 percent fall. Because the
midpoint method gives the same answer regardless of the direc- tion of
change, it is often used when calculating the price elasticity of
demand between two points. In our example, the midpoint between point
A and point B is: Midpoint: Price = $5 Quantity = 100 According to the
midpoint method, when going from point A to point B, the price rises
by 40 percent and the quantity falls by 40 percent. Similarly, when
going from point B to point A, the price falls by 40 percent and the
quantity rises by 40 percent. In both directions, the price elasticity
of demand equals 1. The following formula expresses the midpoint
method for calculating the price elasticity of demand between two
points, denoted (Q, PI) and (Q, P2): Price elasticity of demand — - +
PI)/2\]

  • Comparison

    If the price of 2 slices of Pepperoni Pizza is $4, you sell R). If
you raise the prÄ835'SÄwill sell 6.Qt Find the elasticity of demand
using 12.QLh\_the point and midpoint methods. Is it elastic or
inelastic? Find the total revenue. Did revenue increase or decrease?
By how much? 10 $30 dueasesb $10

Factors That Determine Price Elasticity

  • Whether close substitutes are available

    • Tends to be high if consumers are willing to replace with substitutes.

    • Tends to be low if there are no close substitutes

  • Whether the good is necessity or a luxury

    • Life-saving medication will be inelastic but things you can live without tend to be elastic
  • Time

    • PED tends to increase over time

    • ie. demand for gas is more elastic as behavior changes

  • Share of income spend on the good

    • Elasticity of demand tends to be low when prices are lower

    • Conversely, PED is higher when prices are higher

Price Elasticity Along the Demand Curve

  • Price and total revenue
Inelastic Price↑ Total Revenue↑
Inelastic Price↓ Total Revenue↓
elastic Price↑ Total Revenue↓
elastic Price↓ Total Revenue↑
  • Graph

6-5 FIGURE Price $10 9 8 7 6 5 4 3 2 1 o Total revenue $25 24 21 16 9
The Price Elasticity of Demand Elastic Unit-elastic Changes Along the
Demand Curve Demand Schedule and Total Revenue for a Linear Demand Curve
1 Price $0 1 2 3 4 5 6 7 8 9 10 Quantity demanded 10 9 8 7 6 5 4 3 2
Total revenue $0 9 16 21 24 25 24 21 16 9 2 2 3 3 4 4 5 6 6 7 7 8 8
Inelastic 9 10 Quantity 9 10 Quantity The upper panel shows a demand
curve corre- sponding to the demand schedule in the table. The lower
panel shows how total revenue changes along that demand curve: at each
price and quantity combination, the height of the bar rep- resents the
total revenue generated. You can see that at a low price, raising the
price increases total revenue. So demand is inelastic at low prices. At
a high price, however, a rise in price reduces total revenue. So demand
is elastic at high prices. Demand is elastic: a higher price reduces
total revenue. Demand is inelastic: a higher phce increases total
revenue.

  • Example

    (Example V Assuming that your goal is to maximize revenue, what
portion of the demand curve will you be c, unit-elastic, or inelAic?
operating on: el Explain. elosHC menue

Machine generated alternative text: The slope of a linear demand curve
is constant, but its elasticity is not. The demand schedule FIGURE 4 in
the table was used to calculate the price elasticity of demand by the
midpoint method. At points with a low price and high quantity, the
demand curve is inelastic. At points with a high Elasticity of a Linear
Demand 3.7 1.8 1.0 0.6 0.3 0.1 price and low quantity, the demand curve
is elastic. Price $7 6 4 3 2 0 Elasticity is smaller than 1. 2 4
Elasticity is larger than 1. 6 8 10 12 14 Quantity Curve Elasticity 13.0
Price $7 6 5 4 3 2 1 Quantity 2 4 6 8 10 12 14 Total Revenue (Price x
Quantity) $0 12 20 24 24 20 12 Percentage Change in Price 15 18 22 29 40
67 200 Percentage Change in Quantity 200 67 40 29 22 18 15 Description
Elastic Elastic Elastic Unit elastic Inelastic Inelastic Inelastic

results matching ""

    No results matching ""